Introduction
We are studying the turbulent flow of vapor into the human respiratory system through the use of an e-cigarette. Due to the recent rise of use of e-cigarettes, it is important to investigate how these harmful chemicals enter the body. We are hoping to learn more about the vapor exposure patterns that occur when someone uses an e-cigarette. One specific question we are asking about the flow is where in the respiratory system is the velocity at its maximum. We have chosen this question because the spots where velocity is at a maximum could be more at risk for extreme exposure to the vapor.
Boundary conditions:
The inlet is at the top circle and has an initial velocity of 8m/s with a 10% turbulence intensity (values from journal paper), there is an open boundary at the bottom circle, and the rest of the model is a wall.
=3.17 kg/m3, which is the density of vaporized glycerol, a main ingredient in the vapor of e-cigarettes (microkat)
D=10mm=0.01m
V=8m/s, this is the velocity of the average puff of an e-cigarette (used by the journal paper)
=1.8110-5kg/ms, this is the property of air, we will use it since they act similarly
Re=VD=14011.05 >> 2000, so flow is turbulent
Initial Temp: internal body temp = 310K
E-cigarette vapor enters the body at 8 m/s
Inflow upstream temperature 310 K
Mesh
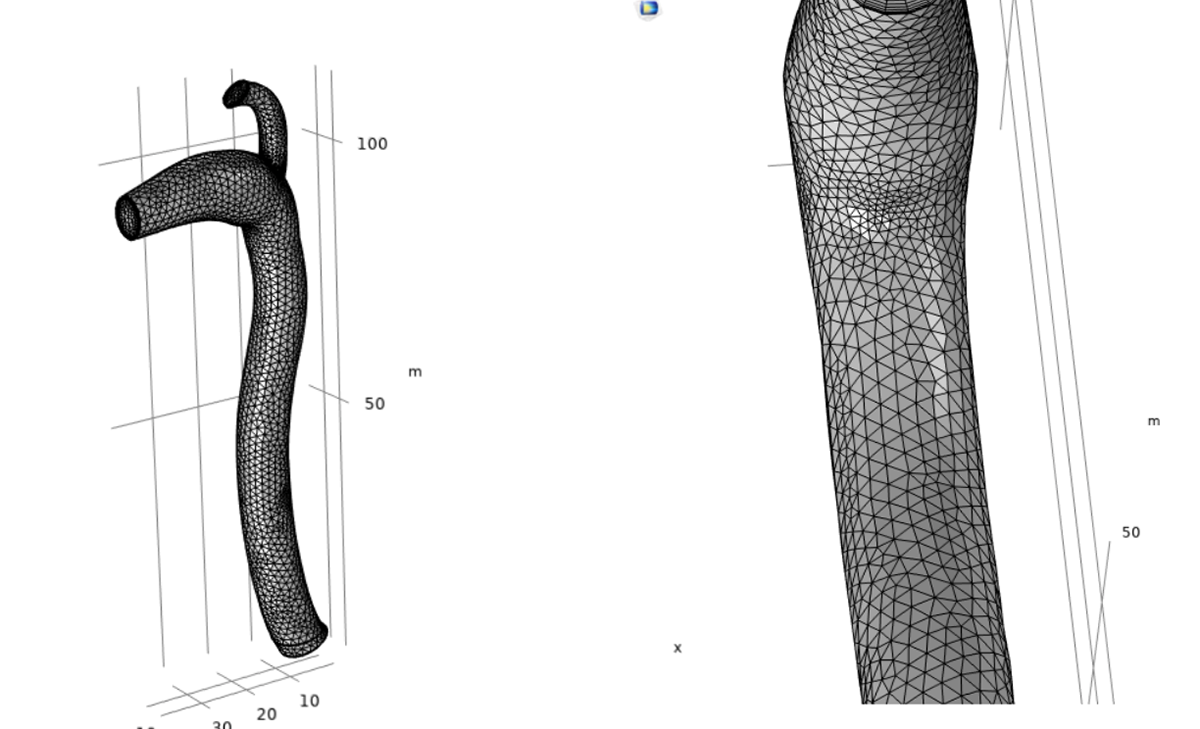
We used a coarse mesh with 65167 domain elements, 6511 boundary elements, and 120 edge elements. The computer solved for 134280 degrees of freedom.
Computation
For the velocity of the vapor, we used the k- turbulent model. This is the model used in the journal paper. Computation time was 7 min, 22 seconds
For the heat transfer from the vapor into the trachea, we used the k- turbulent model with heat transfer in fluids. Computation time was 15 minutes, 15 seconds.
Results
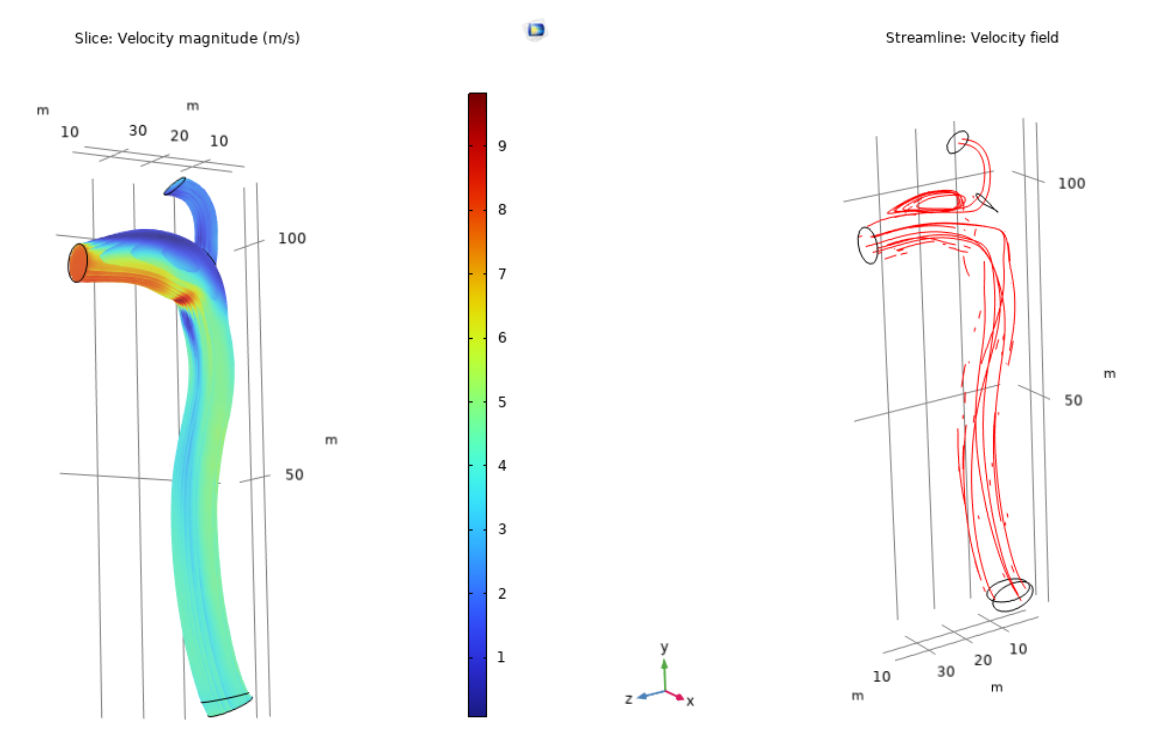
The results of the simulation are shown above in the form of slice, streamline, and isosurface plots. The slice plot clearly shows the flow with a high velocity entering the mouth, then slowly dispersing as the flow travels down the trachea. However, there is a section of high velocity right at the inside bend where the mouth and trachea meet. This conflicts with our previous prediction that there would be low velocity at that spot. Upon using the surface maximum function of COMSOL, it was found that the max velocity is 9.06 m/s, which is higher than the initial inlet velocity of 8 m/s.
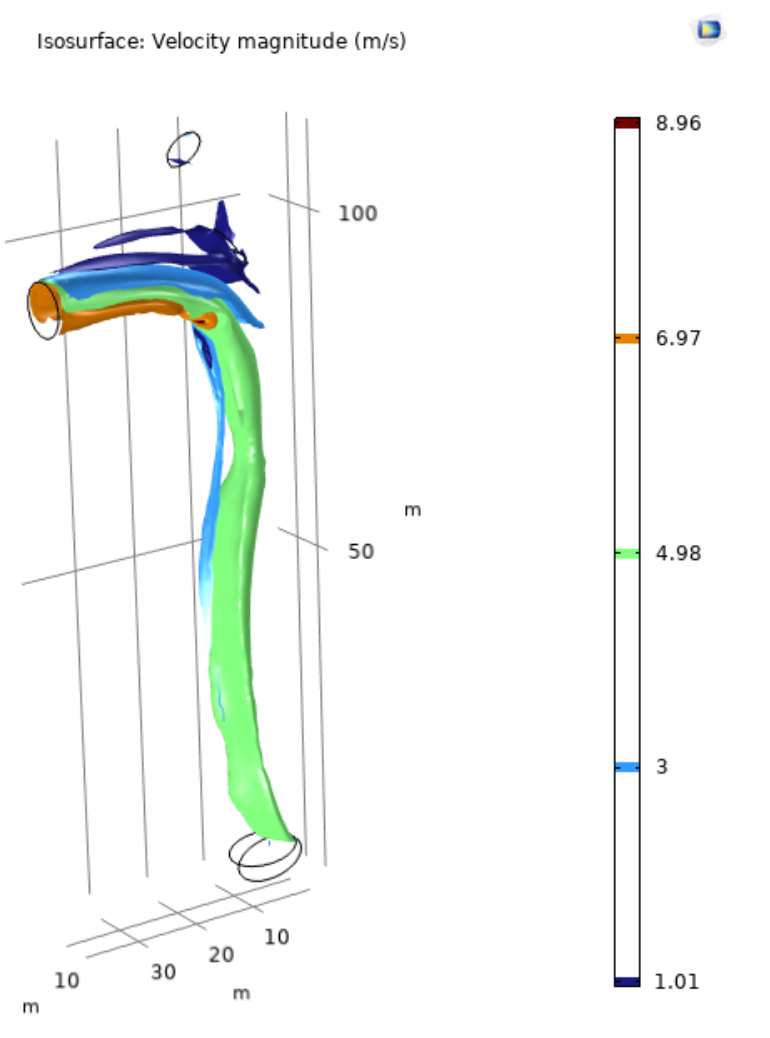
The streamline plot presents the direction of the flow as it travels down the trachea. While most of the streamlines head down towards the rest of the respiratory tract, there are a few lines that get caught in the mouth area in a circular fashion. A few lines also head towards the nasal opening; however, these streamlines are so infrequent that they do not show up on the other plots. The isosurface plot shows areas of constant velocity. There is a large area of a constant 4.98 m/s down the center of the trachea.
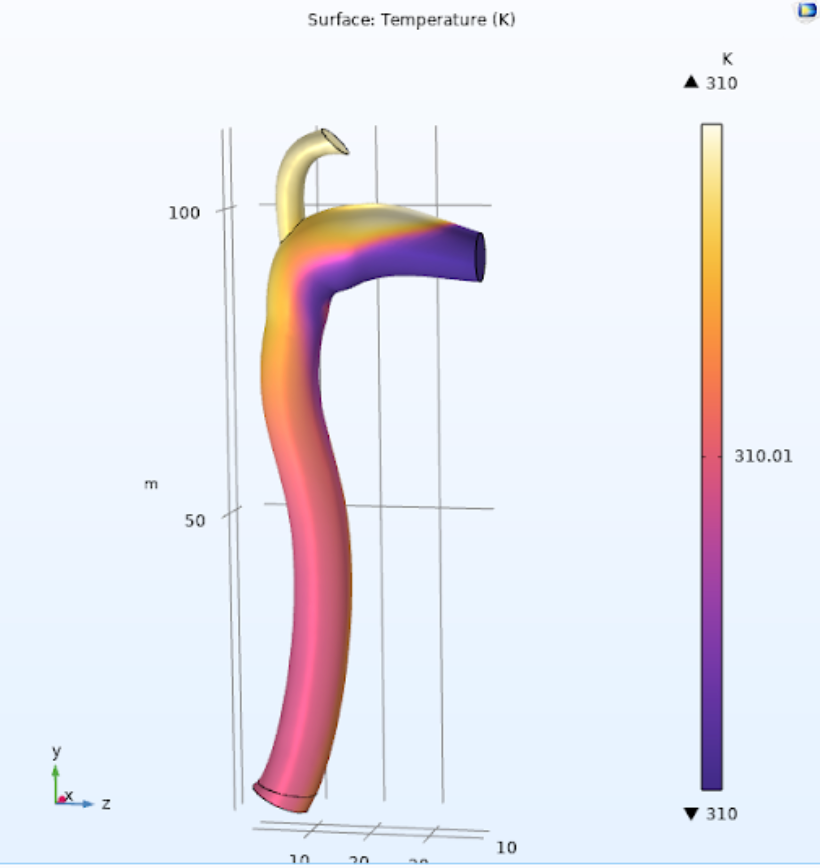
The results for heat transfer are shown to the right with a temperature surface plot. As can be seen in the plot, when the vapor enters the mouth, the temperature is at its minimum, but not by much. As the vapor travels further down the trachea, its temperature increases. The temperature of the vapor is at its maximum at the bottom opening of the trachea. The temperature change and overall heat transfer is small throughout the entire system. Since the liquid from the e-cigarette has already been heated and transformed into vapor prior to entering the mouth, there is not much heat transfer taking place from the trachea into the vapor.